![Bank Statement in Excel: Track & Budget Spending [2026]](/_next/image?url=https%3A%2F%2Fconvertbanktoexcel.com%2Fapi%2Fuploads%2Fimages%2Ffeatured-image-for-bank-statement-in-excel-analysis-guide-showing-charts-and-transaction-data-1774724698210.jpg&w=1920&q=75)
Bank Statement in Excel: Track & Budget Spending [2026]
You converted your bank statement to Excel. You've got a spreadsheet full of dates, amounts, and descriptions. Now what?
Most guides stop at the conversion step. This one picks up where they leave off.
In this guide, you'll learn how to structure, categorize, and analyze your bank statement data so it actually tells you something useful — where your money goes, what your biggest expenses are, and whether your budget is holding up.
No accounting background needed. Just a spreadsheet and 30 minutes.
Get your bank statement into Excel first if you haven't already — it takes about 90 seconds.
Step 1: Set Up Your Bank Statement Columns Correctly
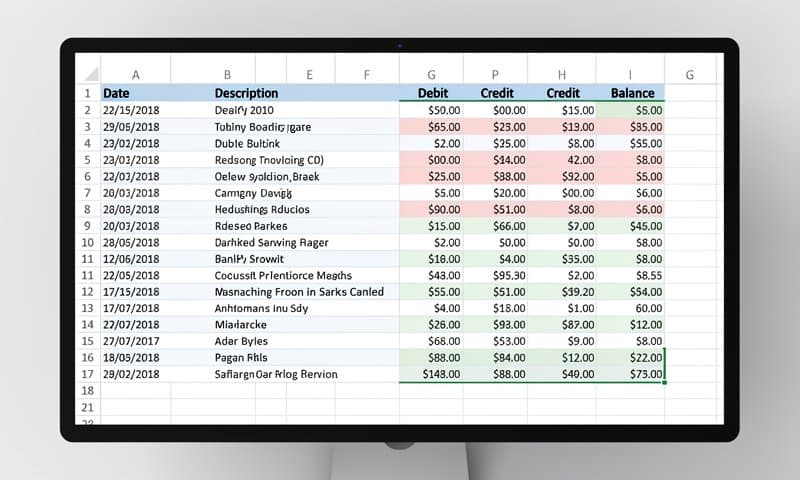
Before you analyze anything, the data needs to be in the right shape. A well-structured bank statement in Excel looks like this:
| Column | What Goes Here |
|---|---|
| A | Date |
| B | Description |
| C | Amount (negative for debits, positive for credits) |
| D | Balance |
| E | Category (you'll add this) |
If your converter already produced this layout, skip ahead. If not, fix a few things first:
Dates: Excel sometimes imports dates as text. Select the date column, go to Data → Text to Columns → Finish. This usually forces Excel to recognize dates properly.
Amounts: Debits and credits sometimes land in separate columns. If yours have separate debit/credit columns, combine them into one:
=IF(C2<>"", -C2, D2)
This turns debits negative and keeps credits positive — which is what you need for SUM formulas to work correctly.
Blank rows: Delete them. Blank rows break SUMIF and pivot tables.
Step 2: Categorize Your Transactions
This is the most valuable step and the one people skip. Without categories, you can total your spending — but you can't see what you're spending on.
Add a Category column (column E). Then go through your transactions and label them:
- Groceries
- Rent / Mortgage
- Utilities
- Dining Out
- Transport
- Entertainment
- Income
- Healthcare
- Subscriptions
Don't overthink the categories. 6-10 is plenty. The goal is to spot patterns, not build an accounting system.
Speed trick: Sort by the Description column (column B) first. Transactions from the same merchant group together — you can label 10 Starbucks charges in one batch instead of one at a time.
Even faster: Use Excel's VLOOKUP to auto-categorize based on keywords in the description. We cover that in the formulas section below.
For credit card data, the process is nearly identical. If you're working with credit card statements, check out the guide on converting credit card statements to Excel for format-specific tips.
Step 3: Formulas That Actually Reveal Your Spending
Once categories are in, these three formulas will show you exactly where your money goes:
SUMIF — Total Spending by Category
=SUMIF(E:E, "Groceries", C:C)
This sums all amounts in column C where column E says "Groceries". Change "Groceries" to any category to get that total.
COUNTIF — How Many Transactions per Category
=COUNTIF(E:E, "Dining Out")
Useful for spotting habits. 47 dining-out transactions in a month is a pattern worth noticing.
SUMIFS — Spending by Category AND Month
=SUMIFS(C:C, E:E, "Transport", A:A, ">="&DATE(2026,1,1), A:A, "<"&DATE(2026,2,1))
This shows transport spending for January 2026 only. Adjust the dates to compare month-over-month.
Auto-Categorize with VLOOKUP
Create a small lookup table on a second sheet with two columns: keywords and categories:
| Keyword | Category |
|---|---|
| AMAZON | Shopping |
| UBER | Transport |
| NETFLIX | Subscriptions |
| WHOLE FOODS | Groceries |
Then in your Category column:
=IFERROR(VLOOKUP("*"&B2&"*", Sheet2!A:B, 2, FALSE), "Other")
This checks if any keyword from your lookup table appears in the transaction description and assigns the category automatically. Anything it doesn't recognize gets labeled "Other" for you to sort manually.
Step 4: Build a Spending Summary and Budget Chart
With categories and SUMIF formulas in place, build a summary table on a new sheet:
| Category | This Month | Last Month | Budget | Difference |
|---|---|---|---|---|
| Groceries | =SUMIF(...) | =SUMIF(...) | 400 | =(C2-E2) |
| Dining Out | =SUMIF(...) | =SUMIF(...) | 150 | =(C3-E3) |
| Transport | =SUMIF(...) | =SUMIF(...) | 200 | =(C4-E4) |
Now select your summary table and insert a Clustered Bar Chart. This gives you a visual comparison of spending vs. budget across all categories in about 30 seconds.
Pivot tables are even faster for this if you know how to use them. Select your full data, go to Insert → PivotTable, drag Category to Rows and Amount to Values. Excel summarizes everything instantly.
What to Look For
Once you have the summary, a few things tend to jump out:
- Subscription creep — small monthly charges that add up to $80-150/month without you noticing
- Dining vs. groceries imbalance — if dining out is 2x your grocery spending, that's usually a budget leak
- One-off large expenses — medical, car repairs, or annual payments that skew the month
- Income timing — when money comes in vs. when bills are due (cash flow gaps)
Step 5: Exporting to Other Formats
Once you've done your analysis in Excel, you might need to get the data into another format:
- For accounting software (QuickBooks, Xero): Export as OFX or QBO — the free vs paid converter comparison covers which tools handle this cleanly
- For CSV import: Most banks and accounting tools accept CSV — check the guide on bank statement to CSV conversion for software-specific instructions
- For tax prep: Keep a copy of the annotated Excel file with categories — it's exactly what your accountant needs
Common Issues with Bank Statements in Excel
Numbers Won't Sum
Usually means amounts are stored as text, not numbers. Select the column, look for a small green triangle in cells — that's the warning. Click Convert to Number in the pop-up, or use:
=VALUE(C2)
Duplicate Transactions
If you imported multiple months and some dates overlap, you might have duplicates. Use:
=COUNTIFS(A:A, A2, B:B, B2, C:C, C2)
Any result greater than 1 means a duplicate. Filter for those and delete.
Dates Sorted Wrong
Dates formatted as text sort alphabetically instead of chronologically. Fix: select the date column → Data → Text to Columns → Date → MDY (or your local format) → Finish.
Categories Not Matching in SUMIF
Check for trailing spaces in your category labels. The formula "Groceries" won't match "Groceries " (with a space). Use:
=TRIM(E2)
to clean up the column.
Conclusion
A bank statement in Excel is only useful if you actually dig into the data. Most people export it, look at the total, and close the file.
With categories + SUMIF + a simple chart, you can see your real spending in 20 minutes. Run this process monthly and you'll notice patterns in a few months that would take years to spot otherwise.
If you haven't converted your bank statement yet, start here — it's free and takes 90 seconds. No signup required, supports all major banks.